

Trying this again after a small error with numbers last time… oops. 😀
The Coleman Medal’s top 10 right now is ordered by how many goals they’ve scored against West Coast, which is a fun coincidence.
Charlie Curnow put 10 past them on the weekend, and I don’t want to take that away from him, here. He also kicked nine against them in their previous game this season, meaning 19 of his 61 goals have happened in two games against the Eagles.
That’s 31.1%.
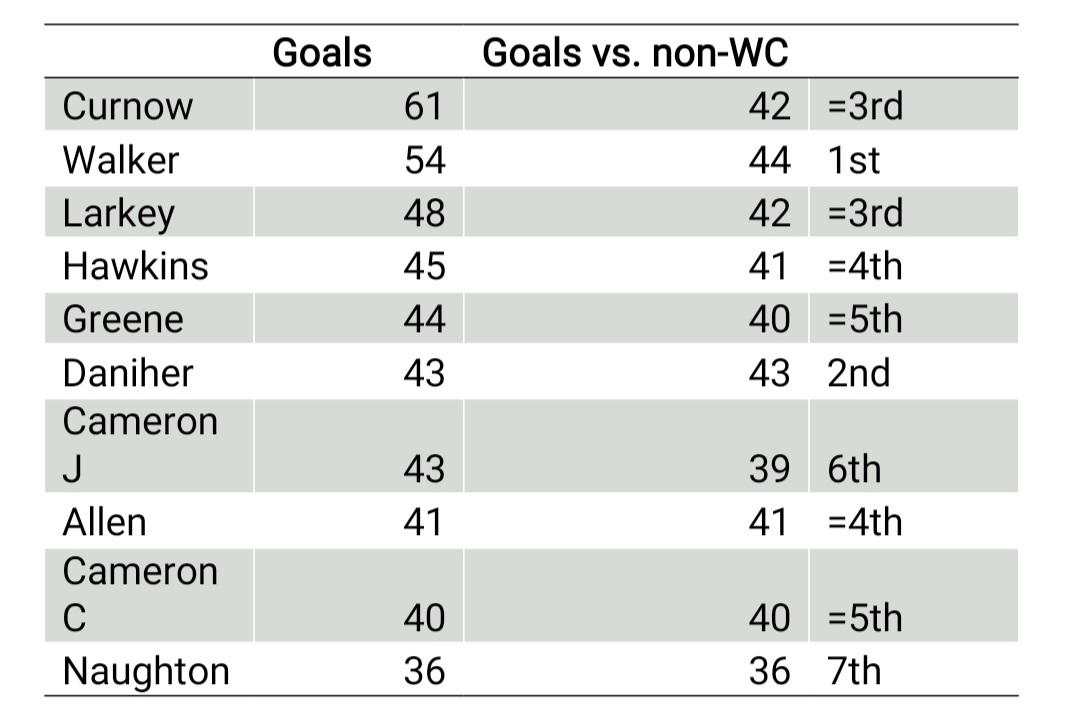
It begged the question – what would the Coleman ladder look like right now if the West Coast Eagles just weren’t around this season? Almost a third of Curnow’s goals as the Coleman leader have come against the bottom placed team. Sure, it’s dominant, but it also feels like downhill skiing to a point. As for the rest of the top 10, you have Tex with ten, Larkey with six, Hawkins, Greene and Jeremy Cameron all with four, whilst Joe Daniher, Charlie Cameron, Oscar Allen (obviously), and Aaron Naughton are all goalless against the Eagles. That means the current Coleman top 10 (no Eagles edition) looks like this:
What does any of this mean/who cares?
Hmmm, stats nerds, people who want to have a free hits at Carlton or West Coast, maybe… quite a few, I’m guessing.
Immediately this table tells you this is a season without a standout key forward. The Coleman table paints a picture of Curnow as an All-Australian lock and near certainty to repeat as Coleman Medallist. When you take out the 19 goals he slotted against the odds-on wooden spooners, that lead gets eaten and not only does he become catchable, he gets caught.
More to the point, all of the top 10 – previously separated by 25 goals – are all within eight goals. Aaron Naughton is suddenly within striking distance if he finishes the season strongly.
I think that’s important.
The story of the season vis a vis the Coleman isn’t who scores the most goals, it’s who takes advantage of the free hit they’re given the most.
Curnow’s averaging 3.39 goals a game this season, almost a goal and a half clear of Naughton (averaging 2.00), but take the West Coast goals out of the equation and suddenly Toby Greene averages the most goals per game, with 2.67.
Again, not to disparage West Coast or Curnow. You’ve still gotta generate and take those chances. It’s telling that across the season, so many of his goals have come in bursts like that.
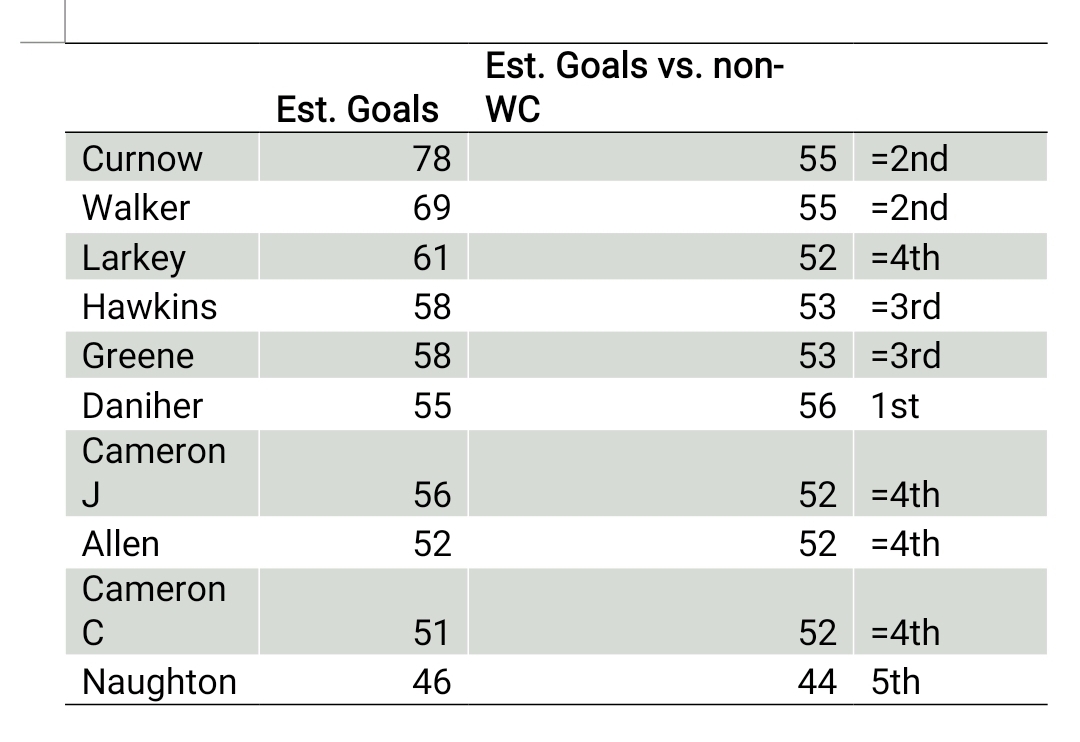
This projected Coleman tally was basically just a matter of average goals*remaining games added onto the goals they’d already scored vs. average goals against not West Coast and the same. Just for methodology’s sake.
Much like the earlier table, parity is the story here. Currently, the actual race projects that Curnow romps home for that second consecutive Coleman, but in the hypothetical we’re talking about here he gets pipped at the post by Joe Daniher in a genuinely unexpected twist.
Again, everyone within relative touching distance of each other.
What does that teach anyone? That there’s no real standout goalscorer in the AFL in 2023, just someone who took their chances to stat pad against West Coast and nine blokes who didn’t. And Oscar Allen, who is here despite the fact that this thought experiment hinges on his team taking the year off.
Does it mean you should rethink making Charlie Curnow an All-Australian lock? Maybe. If you’re an All-Australian voter you’re probably not reading this. But food for thought, regardless.
In real, non-hypothetical Coleman news… Tex is only seven goals back and could, hypothetically, do the inverse of Curnow and kick 9 in the second game after having 10 in the first. If he does this, that moves his average goals per game up to 3.5 and wins him the Coleman by three goals if you prorate the numbers out in exactly the same way. Not related, just something worth keeping an eye on.